How Liquidity Shapes Cryptocurrency Prices: A Deep Dive into Market Depth and Volatility
Have you ever wondered why a $10,000 trade can send the price of a small altcoin plummeting by 20%, while the same amount moves Bitcoin’s price by a fraction of a percent? It isn’t magic, and it isn’t just about how many people are buying or selling. The real driver is liquidity. In the world of cryptocurrency, liquidity is the invisible force that determines how smoothly assets trade and how stable their prices remain.
Think of liquidity as the ease with which you can buy or sell an asset without causing its price to swing wildly. High liquidity means there are plenty of buyers and sellers ready to transact at any given moment, keeping prices steady. Low liquidity creates a fragile market where even small trades can trigger massive price spikes or crashes. Understanding this relationship is crucial for anyone looking to navigate the volatile crypto markets effectively.
The Mechanics of Market Depth and Order Books
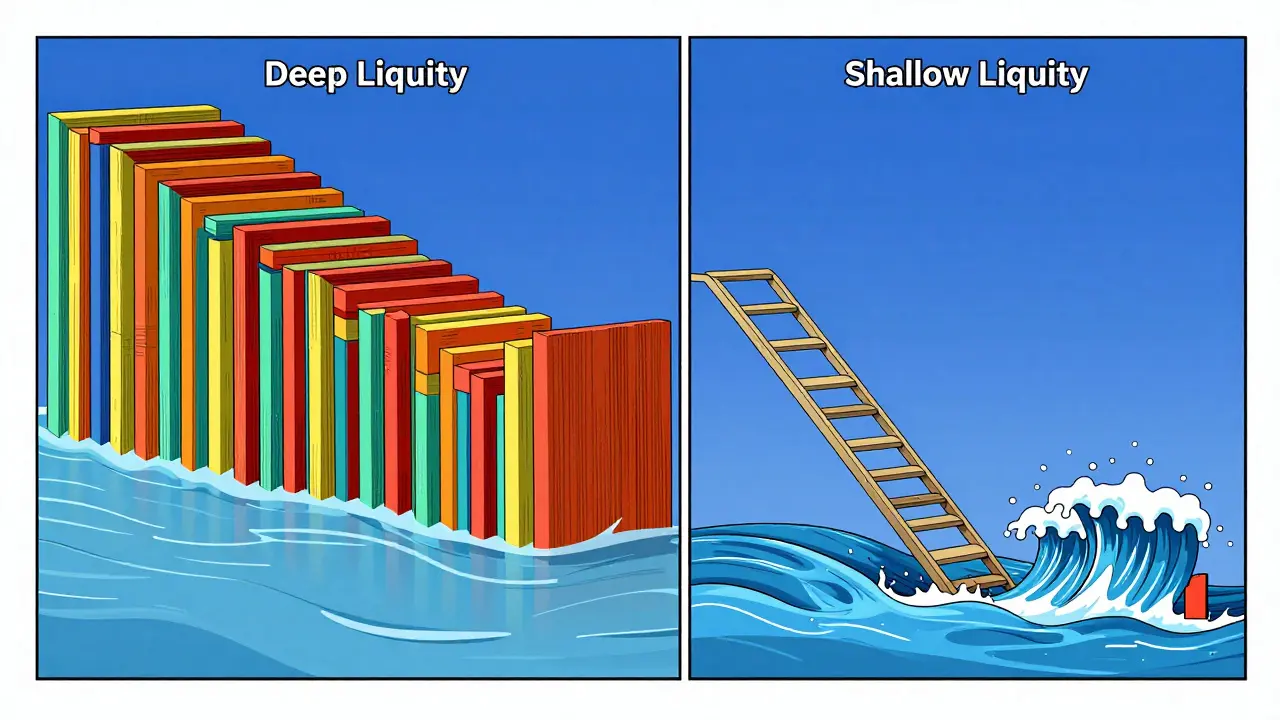
To understand how liquidity impacts price, we first need to look under the hood at the order book. An order book is a list of all pending buy and sell orders for a specific cryptocurrency. The "depth" of this book refers to how many orders exist at various price levels away from the current market price.
When a market has deep liquidity, the order book is thick. There are large volumes of buy and sell orders clustered closely around the current price. If you want to sell 100 ETH, you can do so quickly because there are enough buyers willing to purchase at or near the current price. The price impact is minimal.
In contrast, a shallow market has a thin order book. Large gaps exist between buy and sell orders. If you try to sell 100 ETH in a low-liquidity environment, you might have to accept significantly lower prices to find enough buyers to absorb your entire position. This phenomenon is known as slippage, and it directly results from insufficient market depth.
| Feature | High Liquidity (e.g., BTC/USDT) | Low Liquidity (e.g., Small Cap Altcoins) |
|---|---|---|
| Order Book Depth | Thick; many orders at close price levels | Thin; large gaps between orders |
| Price Impact | Minimal; large trades move price slightly | Significant; small trades cause large swings |
| Slippage | Low | High |
| Volatility | Generally lower and more stable | Higher and more erratic |
| Trading Speed | Fast execution | Slower execution, potential delays |
Liquidity Shocks and Price Volatility
The relationship between liquidity and price stability isn't static; it changes dramatically during times of stress. Research published in Financial Research Letters highlighted this dynamic during the COVID-19 pandemic. Interestingly, cryptocurrency market liquidity actually increased significantly after the World Health Organization declared a worldwide pandemic. Investors were seeking alternatives to traditional financial assets, viewing certain digital assets as potential safe havens.
However, not all cryptocurrencies reacted the same way. The study analyzed the twelve largest cryptocurrencies by market capitalization as of April 2020. It found that Bitcoin, Litecoin, Ethereum, and Cardano demonstrated greater stability in terms of liquidity reliance. These assets had deeper markets that could absorb shocks without extreme price dislocations.
On the other hand, Bitcoin Cash and Bitcoin SV were identified as substantially vulnerable to liquidity shocks. Trading days where liquidity sharply deviated from average levels led to significant effects on price volatility for these assets. When liquidity dries up unexpectedly-a "liquidity shock"-prices can become erratic, leading to rapid declines or spikes that don't necessarily reflect the underlying value of the asset.
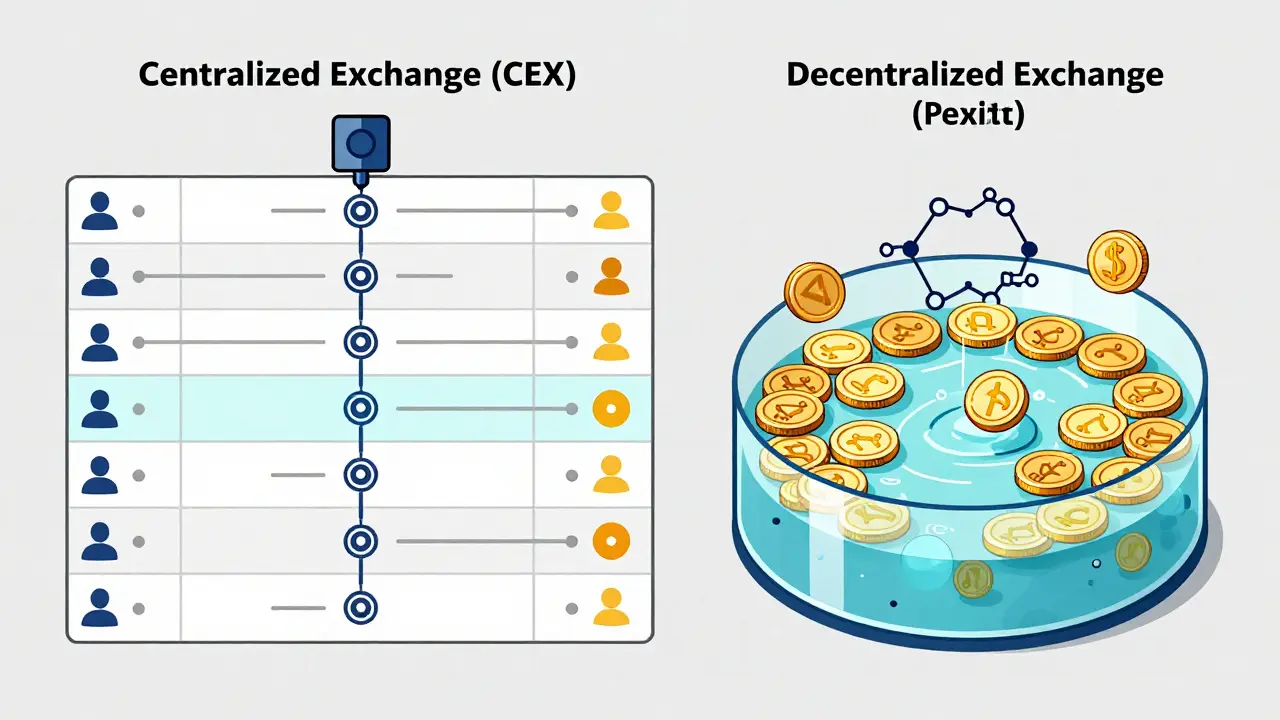
Centralized vs. Decentralized Exchange Dynamics
Where you trade also dictates how liquidity affects your entry and exit prices. The structure of liquidity provision differs fundamentally between Centralized Exchanges (CEXs) and Decentralized Exchanges (DEXs).
On centralized exchanges like Binance or Kraken, liquidity is provided through traditional order books. Market makers place limit orders to buy and sell, creating a continuous market. Analysis shows that USDT liquidity is much greater against major digital assets like ETH and BTC than against fiat currencies. For instance, the average 1% market depth for BTC-USDT on Binance is significantly higher than for EUR-USDC. This is because crypto-to-stablecoin pairs avoid traditional banking constraints, such as Know Your Customer (KYC) checks and bank fees, allowing for seamless integration into trading strategies.
In contrast, decentralized exchanges rely on Automated Market Makers (AMMs). Instead of an order book, AMMs use liquidity pools where users deposit pairs of tokens. Prices are determined by a mathematical formula based on the ratio of assets in the pool. While AMMs provide 24/7 access to liquidity, they can suffer from impermanent loss and may have different price impact curves compared to CEXs. During periods of high volatility, the liquidity available in AMM pools can be depleted faster than in deep CEX order books, leading to higher slippage for large trades.
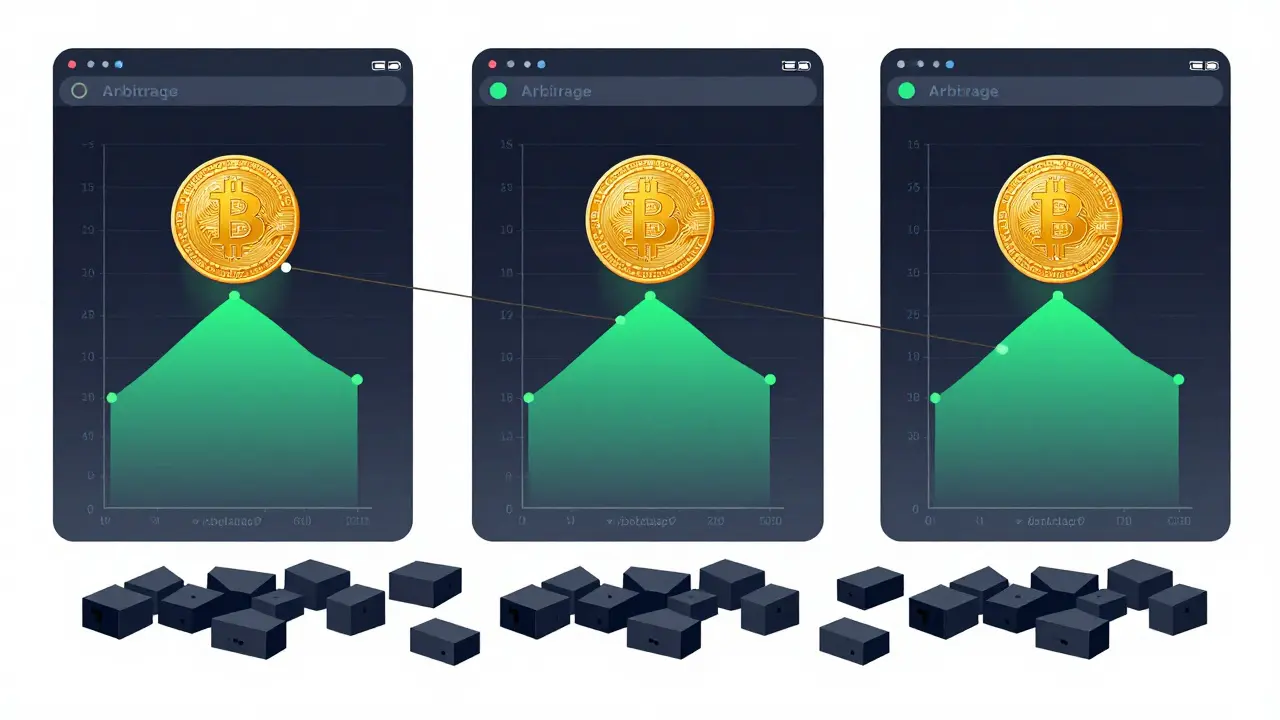
The Fragmentation Problem Across Exchanges
A unique challenge in the crypto space is liquidity fragmentation. Unlike traditional stock markets, which often have a primary exchange, crypto assets are traded across hundreds of platforms. Research from Kaiko indicates that while price discrepancies have decreased over time, they persist.
This fragmentation means that identical assets can trade at different prices on different exchanges. The magnitude of these discrepancies is directly related to the depth of liquidity available on each platform. For traders, this presents both opportunities and risks. Arbitrageurs can profit from price differences, but for the average investor, it introduces execution risk. If you place a large order on a less liquid exchange, you might get a worse price than if you split the order across multiple venues.
For example, during the Silicon Valley Bank crisis in March 2023, order books became less stable, and price movements became erratic. Analysis of the USDC-USD pair on Kraken showed a widening gap between market depths at the 1% and 10% levels. At the 1% level near the peg, there were few executable trades. However, at the 10% level, participants were more willing to buy larger orders. This disparity highlights how liquidity can vanish at tight spreads during panic, forcing traders to accept wider spreads to execute trades.
Market Makers and Incentive Structures
Who provides this critical liquidity? In traditional finance, specialized firms called market makers earn fees for providing continuous buy and sell quotes. In crypto, the landscape is more diverse. A comprehensive report from February 2025 examined market-making incentives across exchange-based schemes, AMM mechanisms, and institutional strategies.
The findings revealed that different incentive structures substantially influence the depth and resilience of crypto markets. On centralized exchanges, market makers are often incentivized by rebates or fee discounts. In decentralized finance (DeFi), "liquidity mining" rewards providers with token incentives. These strategies have become integral to the market microstructure, influencing both the quantity and quality of liquidity.
However, the effectiveness of these incentives varies. Some protocols attract "mercenary capital," where liquidity providers chase high yields and withdraw quickly when incentives drop. This can lead to sudden liquidity drains, increasing volatility. Institutional liquidity provisioning strategies, on the other hand, tend to offer more consistent depth, contributing to greater price stability for major assets.
Security Breaches and Liquidity Disruption
Liquidity isn't just affected by market sentiment; it can be severely impacted by security events. A stark example occurred on February 21, 2025, when Bybit, one of the world's largest cryptocurrency exchanges, experienced a security breach resulting in the theft of approximately $1.4 billion worth of Ether (ETH) and related tokens from its cold wallet.
The aftermath was telling. Analysis of trading volume showed a significant spike on the day of the hack, followed by a lowered volume regime-approximately half of pre-attack levels-in the immediate aftermath. This dramatic liquidity disruption demonstrates how exchange-specific events can create localized but significant impacts on trading activity. When trust in an exchange erodes, market makers pull back, order books thin out, and price volatility increases as remaining traders react to uncertainty.
Corporate Adoption and Future Trends
As the cryptocurrency market matures, new players are entering the liquidity game. Corporate adoption of cryptocurrency for liquidity management represents an emerging trend. Analysis from Kyriba explores how blockchain innovations and regulatory shifts are reshaping corporate liquidity strategies in 2025.
As more companies integrate cryptocurrency into their treasury frameworks, this could introduce new sources of liquidity. Corporate treasuries typically hold large amounts of capital, and their participation could deepen markets and reduce volatility. However, this evolution is subject to regulatory developments and risk management considerations. Regulatory frameworks aimed at fostering stable and transparent digital asset markets must account for the critical role of liquidity provision. Policies that support robust liquidity provision through appropriate incentive structures could contribute to more stable markets, while overly restrictive regulations might reduce liquidity provision.
Practical Tips for Traders Navigating Liquidity
Understanding liquidity helps you make better trading decisions. Here are some practical steps to manage liquidity risk:
- Check Market Depth Before Trading: Don't just look at the current price. Look at the order book. Are there enough orders at nearby price levels to absorb your trade?
- Use Limit Orders: Instead of market orders, which can suffer from high slippage in illiquid markets, use limit orders to control the price you pay or receive.
- Diversify Exchange Exposure: Be aware of liquidity fragmentation. Check prices and depths across multiple exchanges before executing large trades.
- Monitor Volume Trends: Sudden drops in trading volume can signal drying liquidity. Be cautious of entering positions when volume is declining rapidly.
- Prefer Major Pairs: Stick to high-liquidity pairs like BTC/USDT or ETH/USDT for better price stability and lower transaction costs.
What is the difference between liquidity and volume?
Volume refers to the total amount of an asset traded over a specific period. Liquidity refers to the ability to buy or sell that asset without affecting its price. You can have high volume but low liquidity if most trades are happening at widely dispersed prices, indicating a lack of consistent market depth.
Why does low liquidity lead to higher volatility?
In a low-liquidity market, there are fewer buy and sell orders. This means that even relatively small trades can exhaust the available orders at the current price, forcing the next trade to occur at a significantly different price. This causes sharp price swings, or volatility.
How do I check the liquidity of a cryptocurrency?
You can check liquidity by looking at the order book depth on an exchange. Look for the spread between the highest bid and lowest ask; a narrow spread usually indicates good liquidity. Additionally, check the trading volume and the size of orders in the order book. Tools like CoinMarketCap or CoinGecko also provide liquidity metrics for decentralized exchanges.
What is slippage in crypto trading?
Slippage is the difference between the expected price of a trade and the actual price at which the trade executes. It occurs primarily in low-liquidity markets where there aren't enough orders at the desired price level, forcing the trade to fill at worse prices further down the order book.
Does liquidity affect gas fees on Ethereum?
Indirectly, yes. High liquidity and trading activity often correlate with high network congestion on Ethereum, which drives up gas fees. When many users are trying to interact with decentralized exchanges (which provide liquidity), demand for block space increases, raising the cost of transactions.